Custom Monitoring in Godot 4
Out of the box, Godot gives you all sorts of ways to monitor your game’s performance and behavior. You can monitor the FPS, draw calls, memory usage, number of objects, and much more, but you can also define your own custom monitors to track whatever’s of interest to you, something I’ve done on Unto Deepest Depths to help me track areas of interest for both performance and balance.
To monitor custom metrics you can simply call Performance.add_custom_monitor() and provide an ID for your metric and a function that can be called to provide the current metric value. This function will automatically be called periodically at runtime, so you while you do need to store the value you’ll want to return somewhere in your code, you only need to store, and your function only needs to return, the current value. Godot will take care of showing you the historical values in the chart. And it’s worth noting that while both floats and integers are supported, those values cannot be negative and will be clamped to zero if provided.
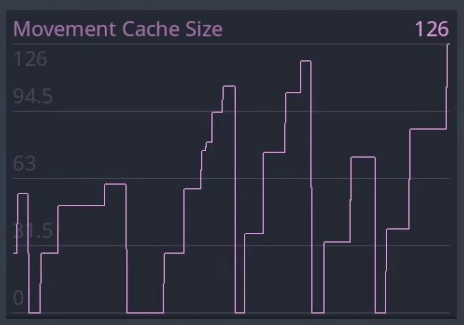
As an example of using custom monitors in Unto Deepest Depths, I cache basic navigation data during battles to speed up AI decision making. When adding this feature I decided to monitor it so that in the short term I could easily verify the cache was working correctly, and in the long term to have an idea of how large that cache typically gets. So in my navigation service, I call Performance.add_custom_monitor('Navigation/Movement Cache Size', _get_movement_cache_size) to register the monitor, and then define _get_movement_cache_size() to return an integer of how many cache entries there are:
# Nested dictionary where the first layer is the starting cell,
# the second layer is the destination cell,
# and the final value is the distance between them
#
# Ex:
# movement_cell_cache = {
#     Vector2i(1, 1): {
#         Vector2i(2, 1): 1,
#         Vector2i(3, 1): 2
#     }
# }

var movement_cell_cache: Dictionary = {}

func _ready() -> void:
	Performance.add_custom_monitor('Navigation/Movement Cache Size', _get_movement_cache_size)

func _get_movement_cache_size() -> int:
	var count = 0

	for key in movement_cell_cache.keys():
		count += movement_cell_cache[key].keys().size()

	return count
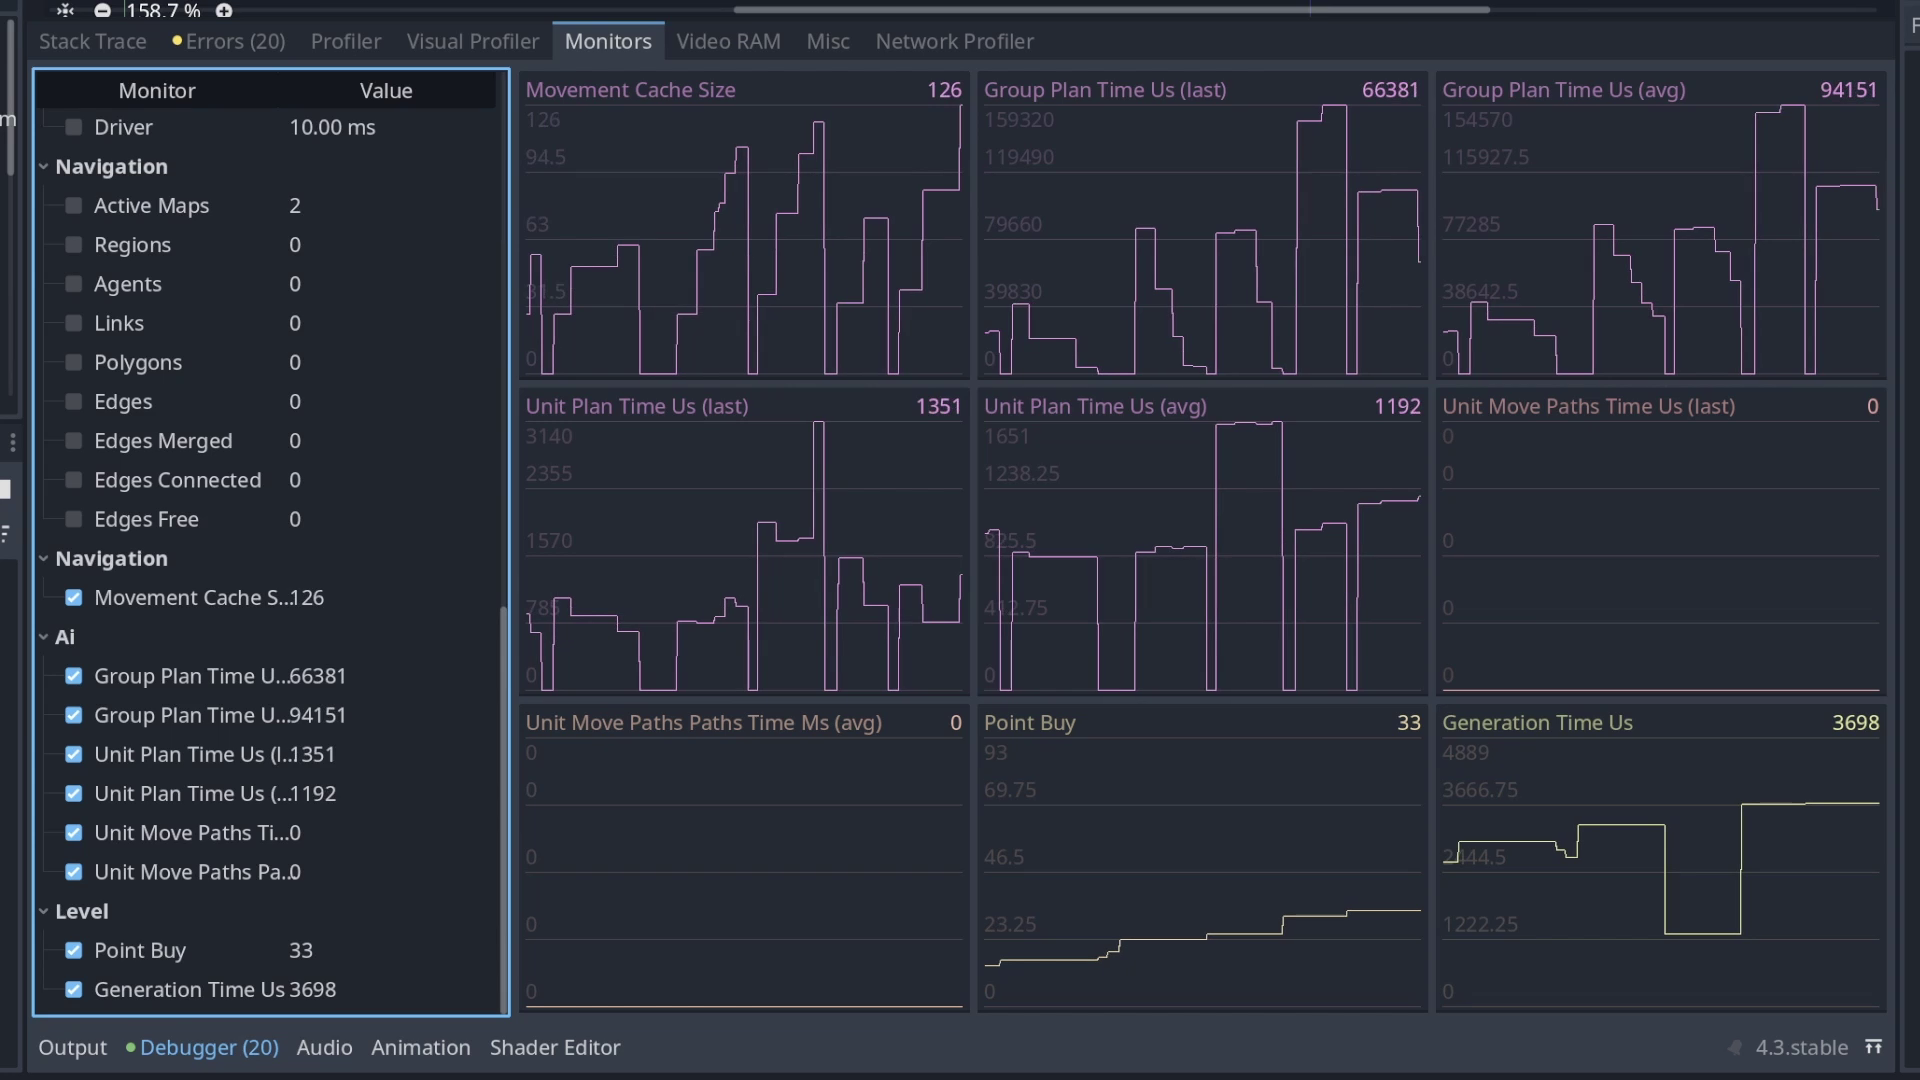
With this setup, I can now monitor how large my navigation cache is by simply opening up the Debugger tools, going to the Monitors tab, and checking my custom monitor.
I also use custom monitors for monitoring how long a level takes to generate, how long the AI takes to process certain information, and even to track game balance, which might seem a bit odd at first but is actually pretty straightforward. I use a point buy system in Unto Deepest Depths to generate levels, meaning I convert the player’s progress into a numerical value, assign point “costs” to each enemy type, and then “purchase” enemies with the points available based on the player’s progress. This means that as I’ve been testing and balancing the game, I can, at any time, open my custom monitor and see the exact point budget was used to generate a level, making it easy to see why a level was generated as it was and intuit what balance changes may be needed to make things fairer.
Additional usage notes
In demoing my monitors, you may have noticed that they each fall under a specific category, such as “Navigation”, “AI”, and “Level”. That’s because I’m using a built-in feature of custom monitors where if a slash delimiter is present in a monitor ID, the text before the slash will be considered the category name, the text after will be considered the monitor name, and at runtime all of your monitors will be grouped into their relevant categories, making it easy to find what you’re looking for. If you choose to exclude a slash, or include several slashes in your monitor ID, your monitor will end up in the default “Custom” category.
Another thing worth noting is that you can only add a monitor once, with subsequent attempts to create the same monitor resulting in an error. If you are unsure if a monitor has been created, you can call Performance.has_custom_monitor() with the name of the monitor to check.
Similarly, you can call Performance.get_custom_monitor() to programmatically access the current value of given monitor, which is supported even in release builds, but that’s left as an exercise for the reader.